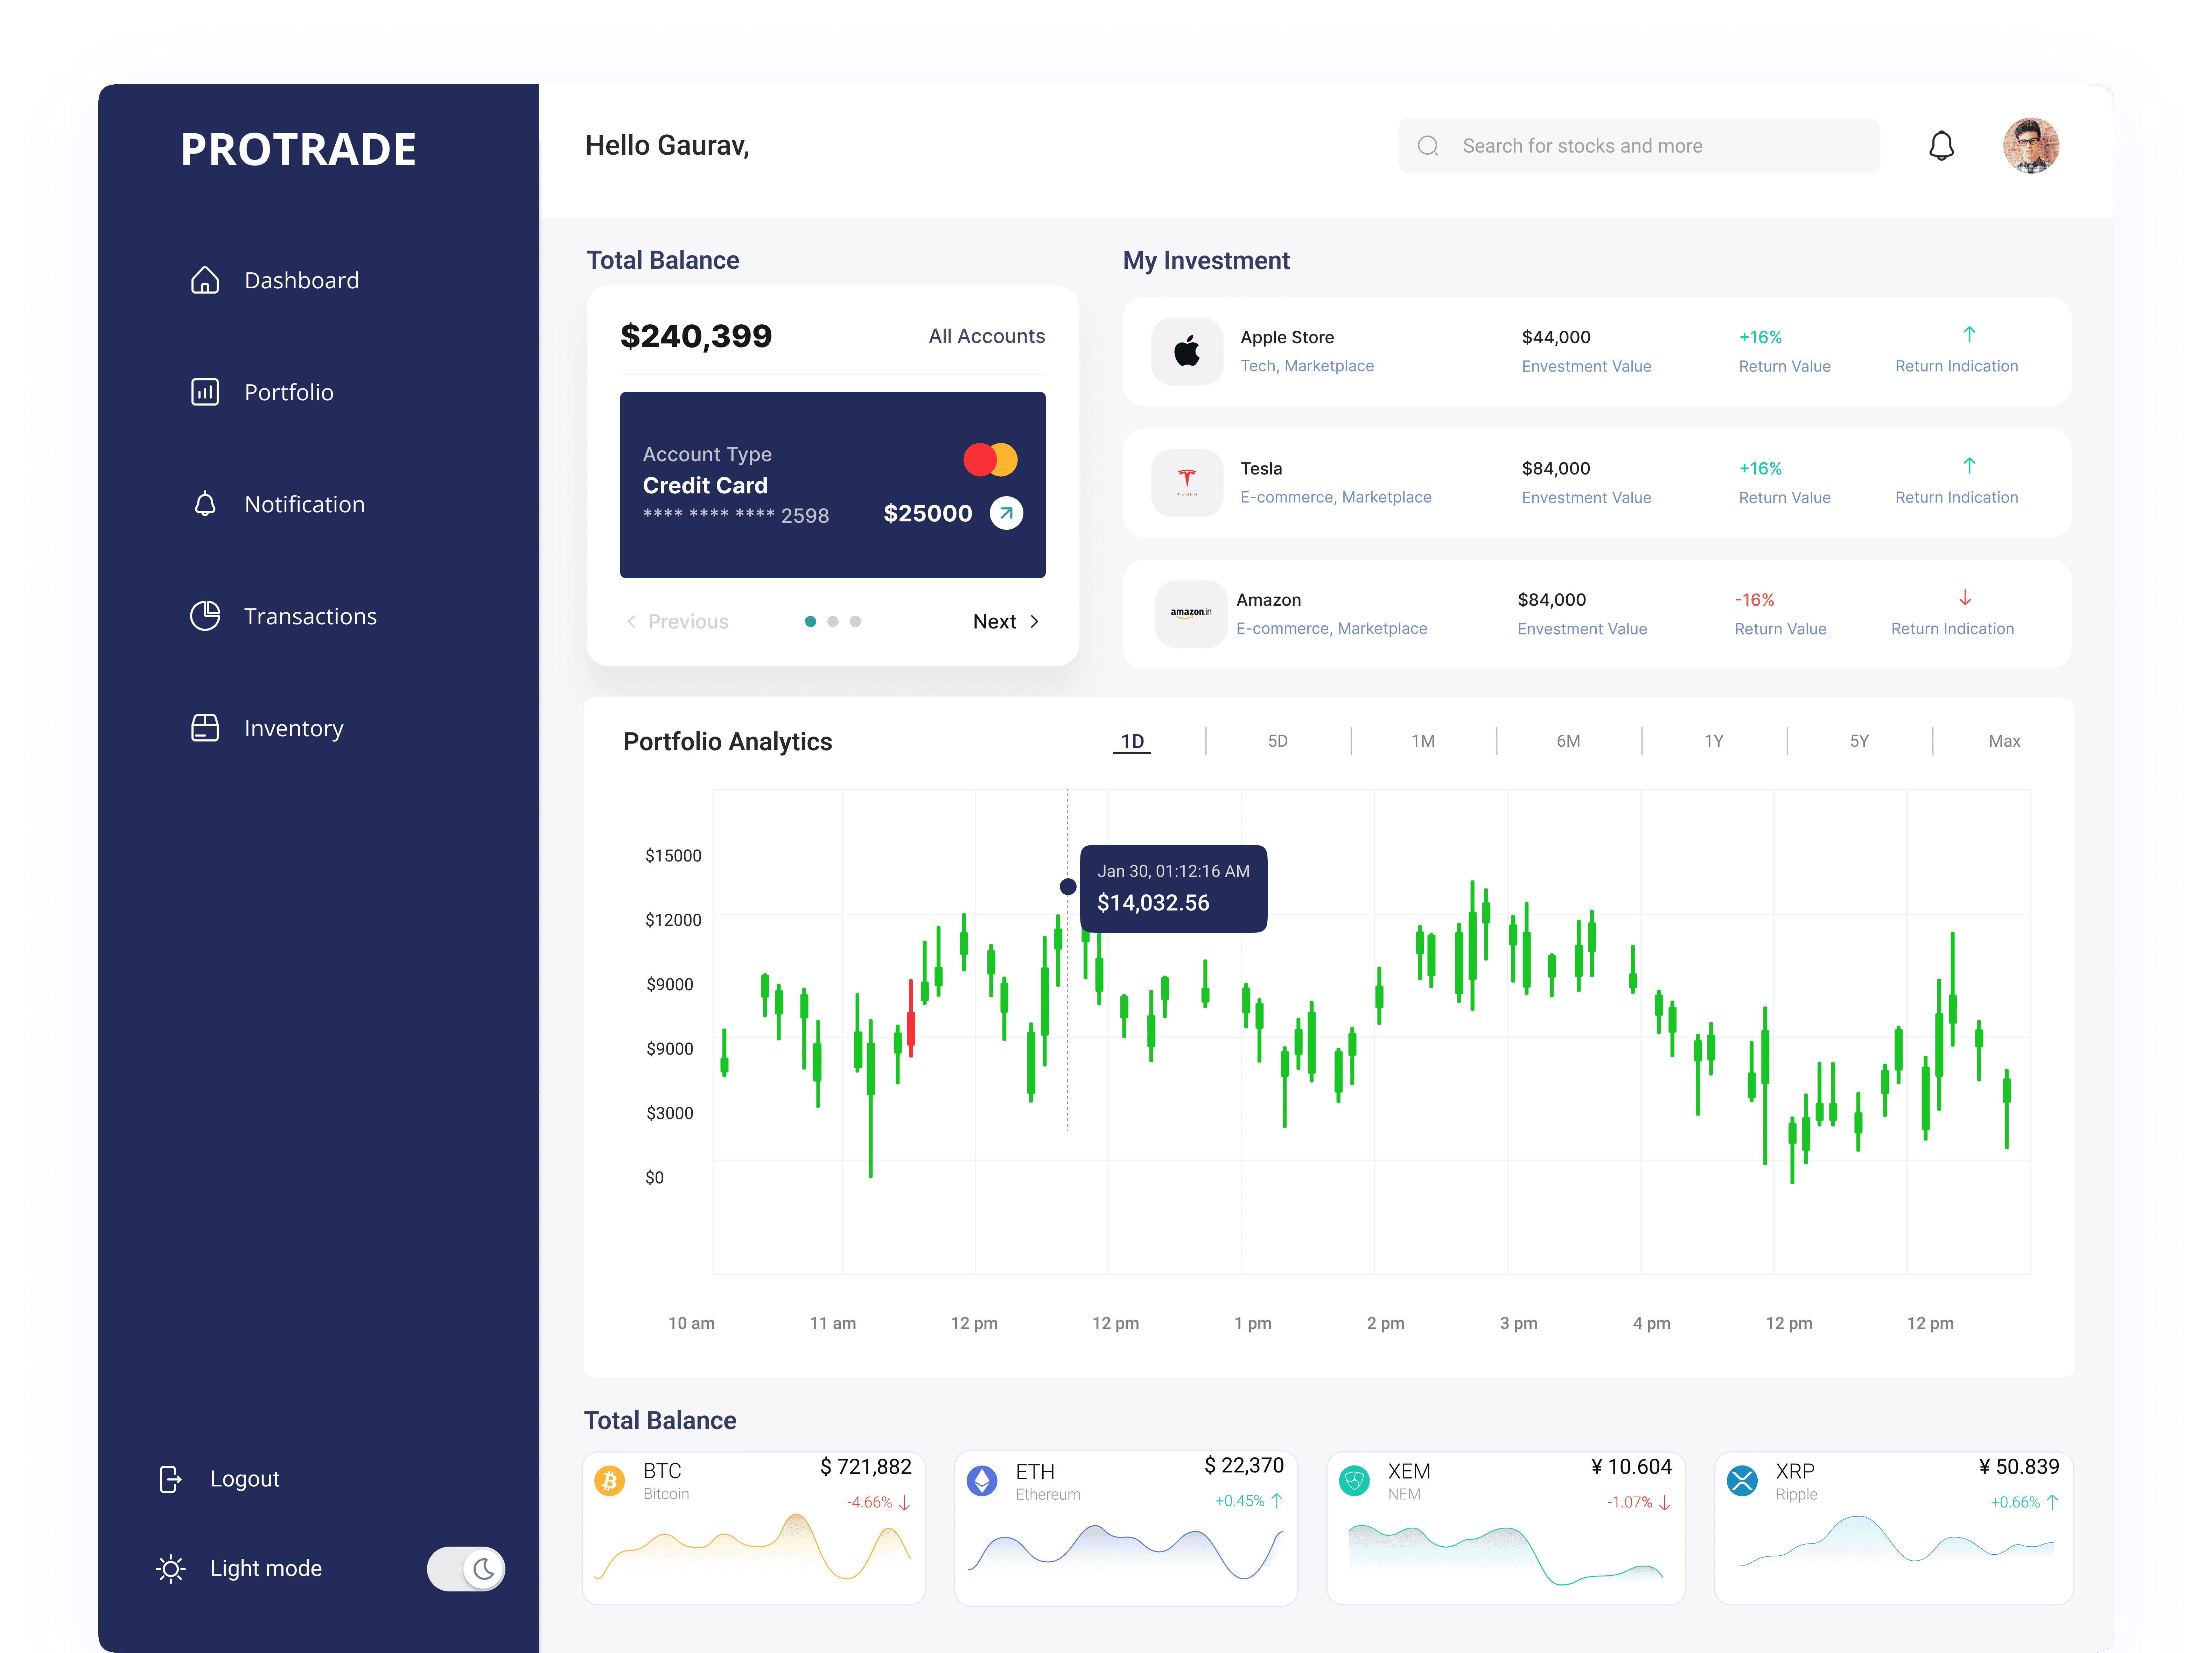
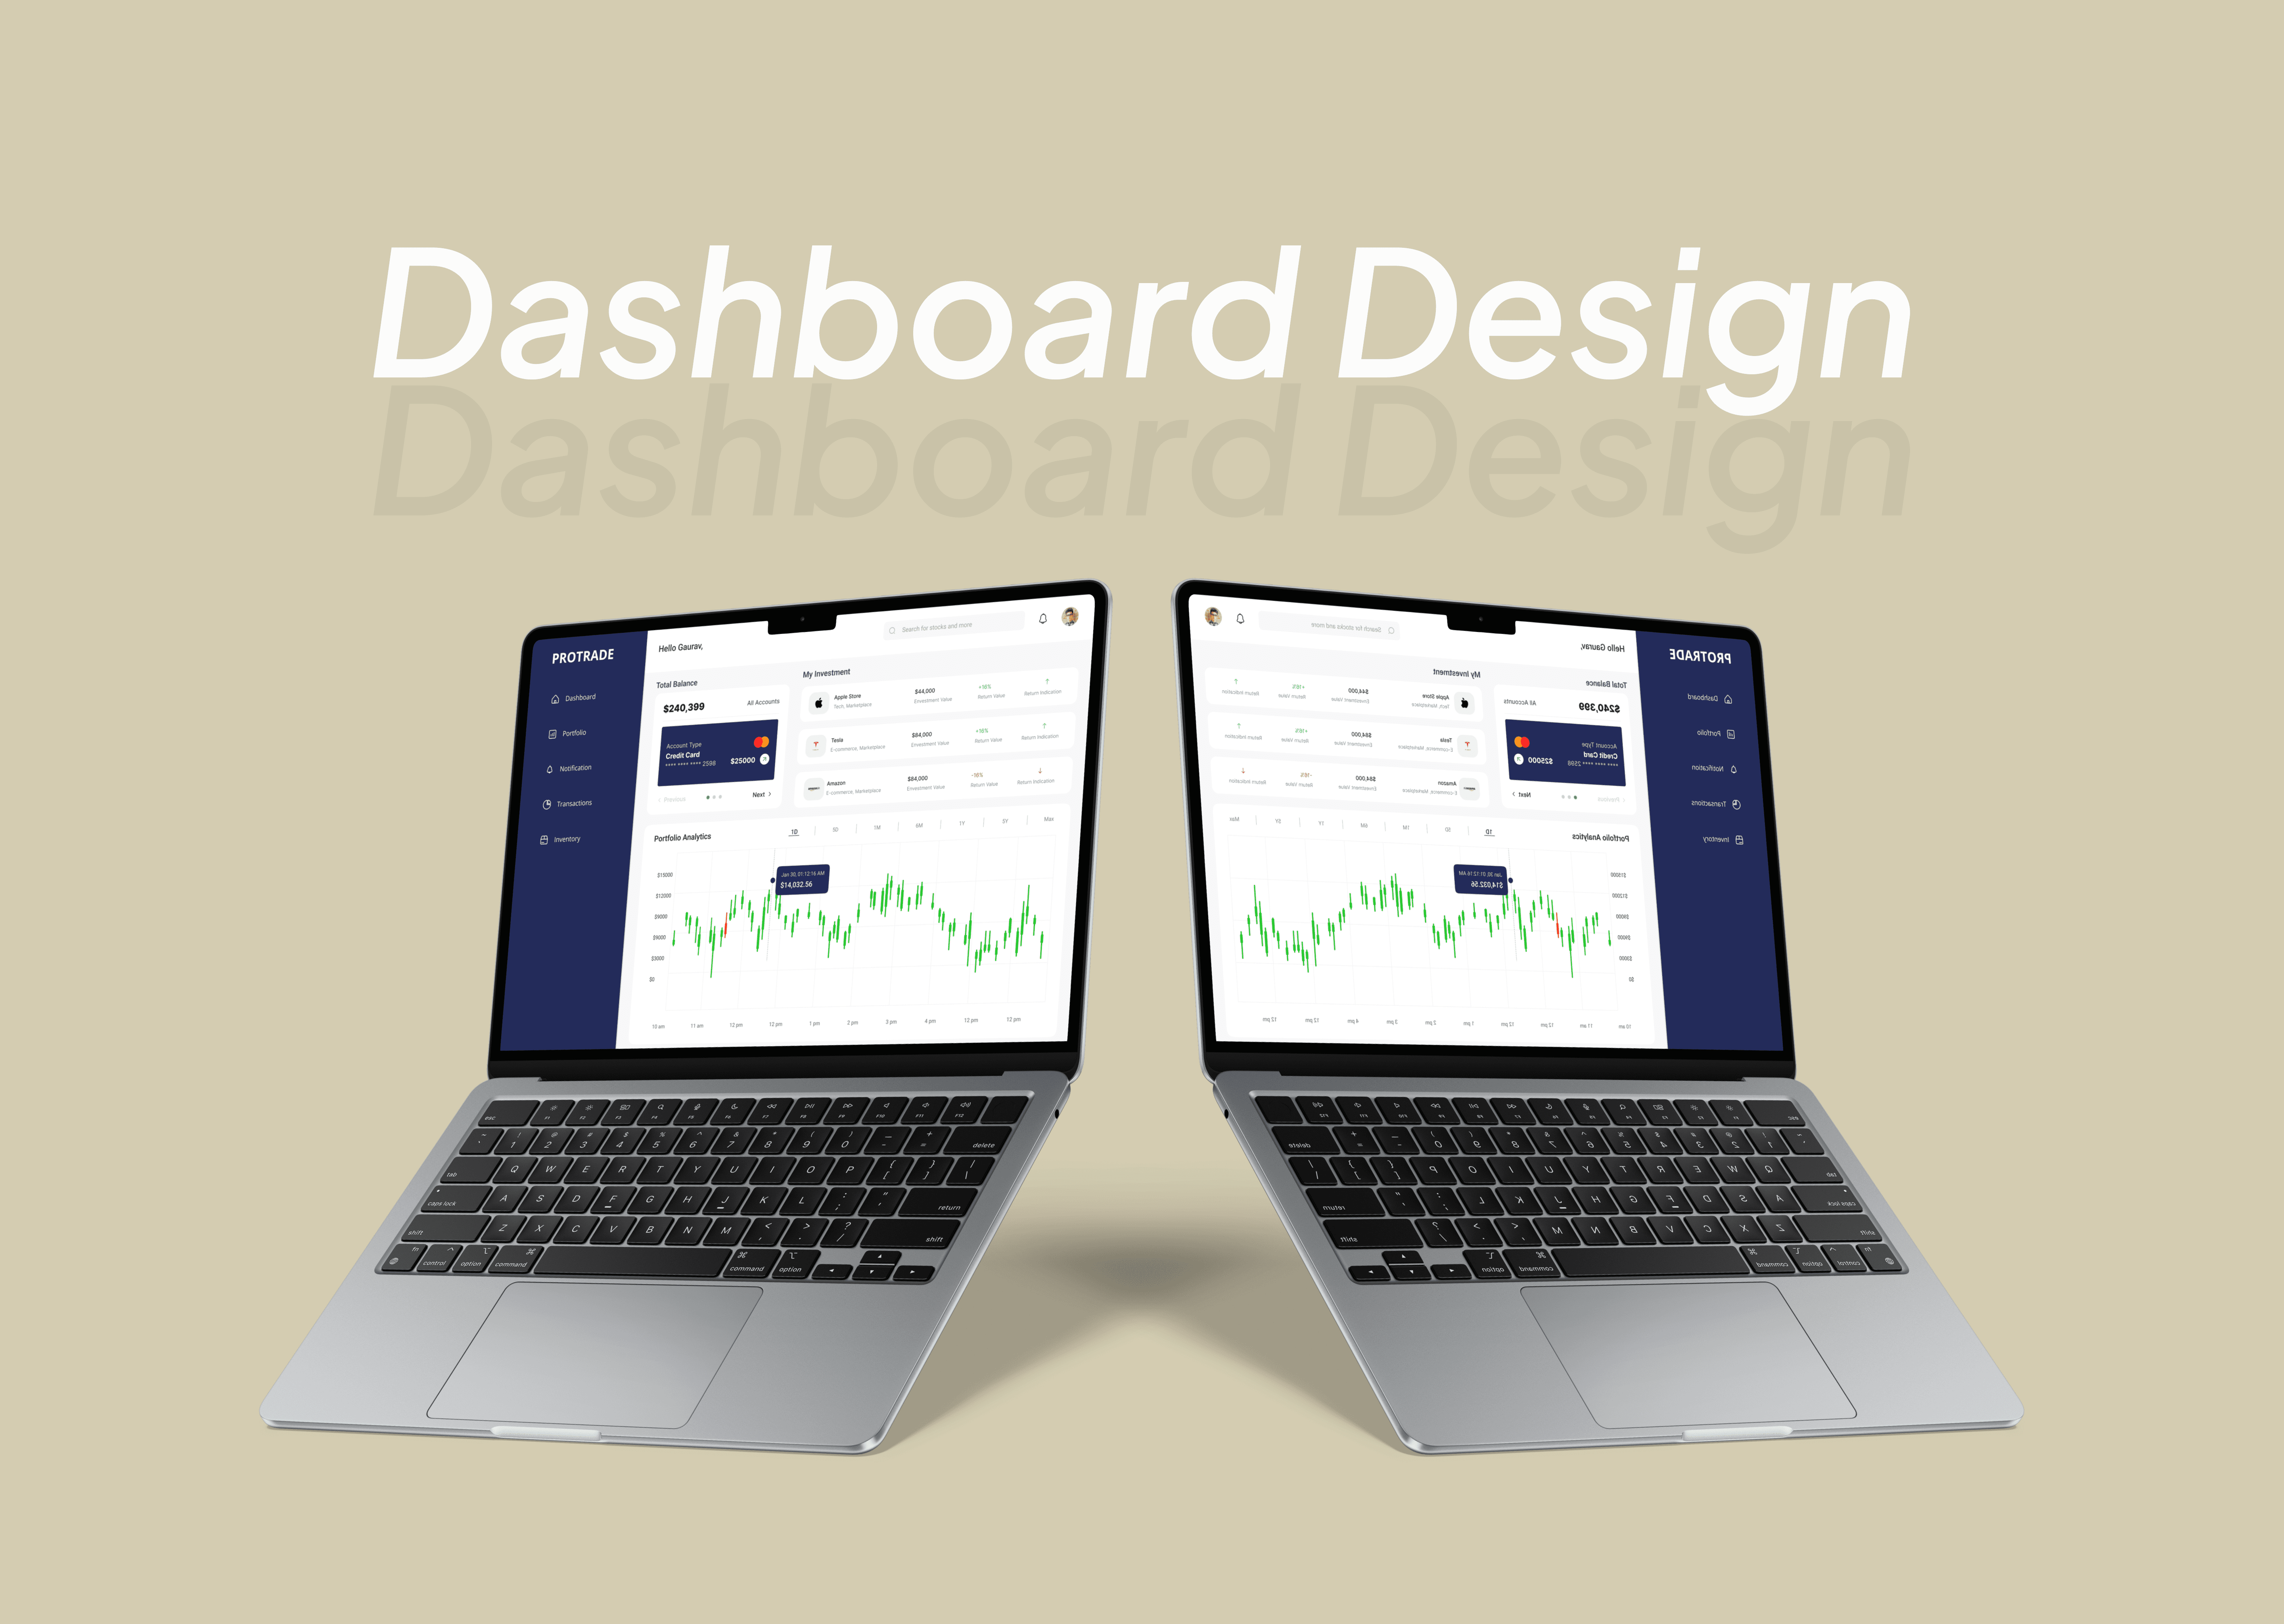
A set of dashboard designs focused on structuring complex data into clear, readable, and actionable interfaces. The goal was to improve how users scan information, track metrics, and navigate data-heavy environments.
Salescheck Dashboard
Dashboard Overview
Designed a financial overview dashboard for tracking investment portfolios and performance trends. The key challenge was presenting dense numerical data without overwhelming the user. solved through card hierarchy, selective color coding for gains/losses, and progressive disclosure of detail.
Approach
Focused on organizing data into sections, using card-based layouts, and improving visual hierarchy for quick understanding.

Protrade Dashboard
Dashboard Overview
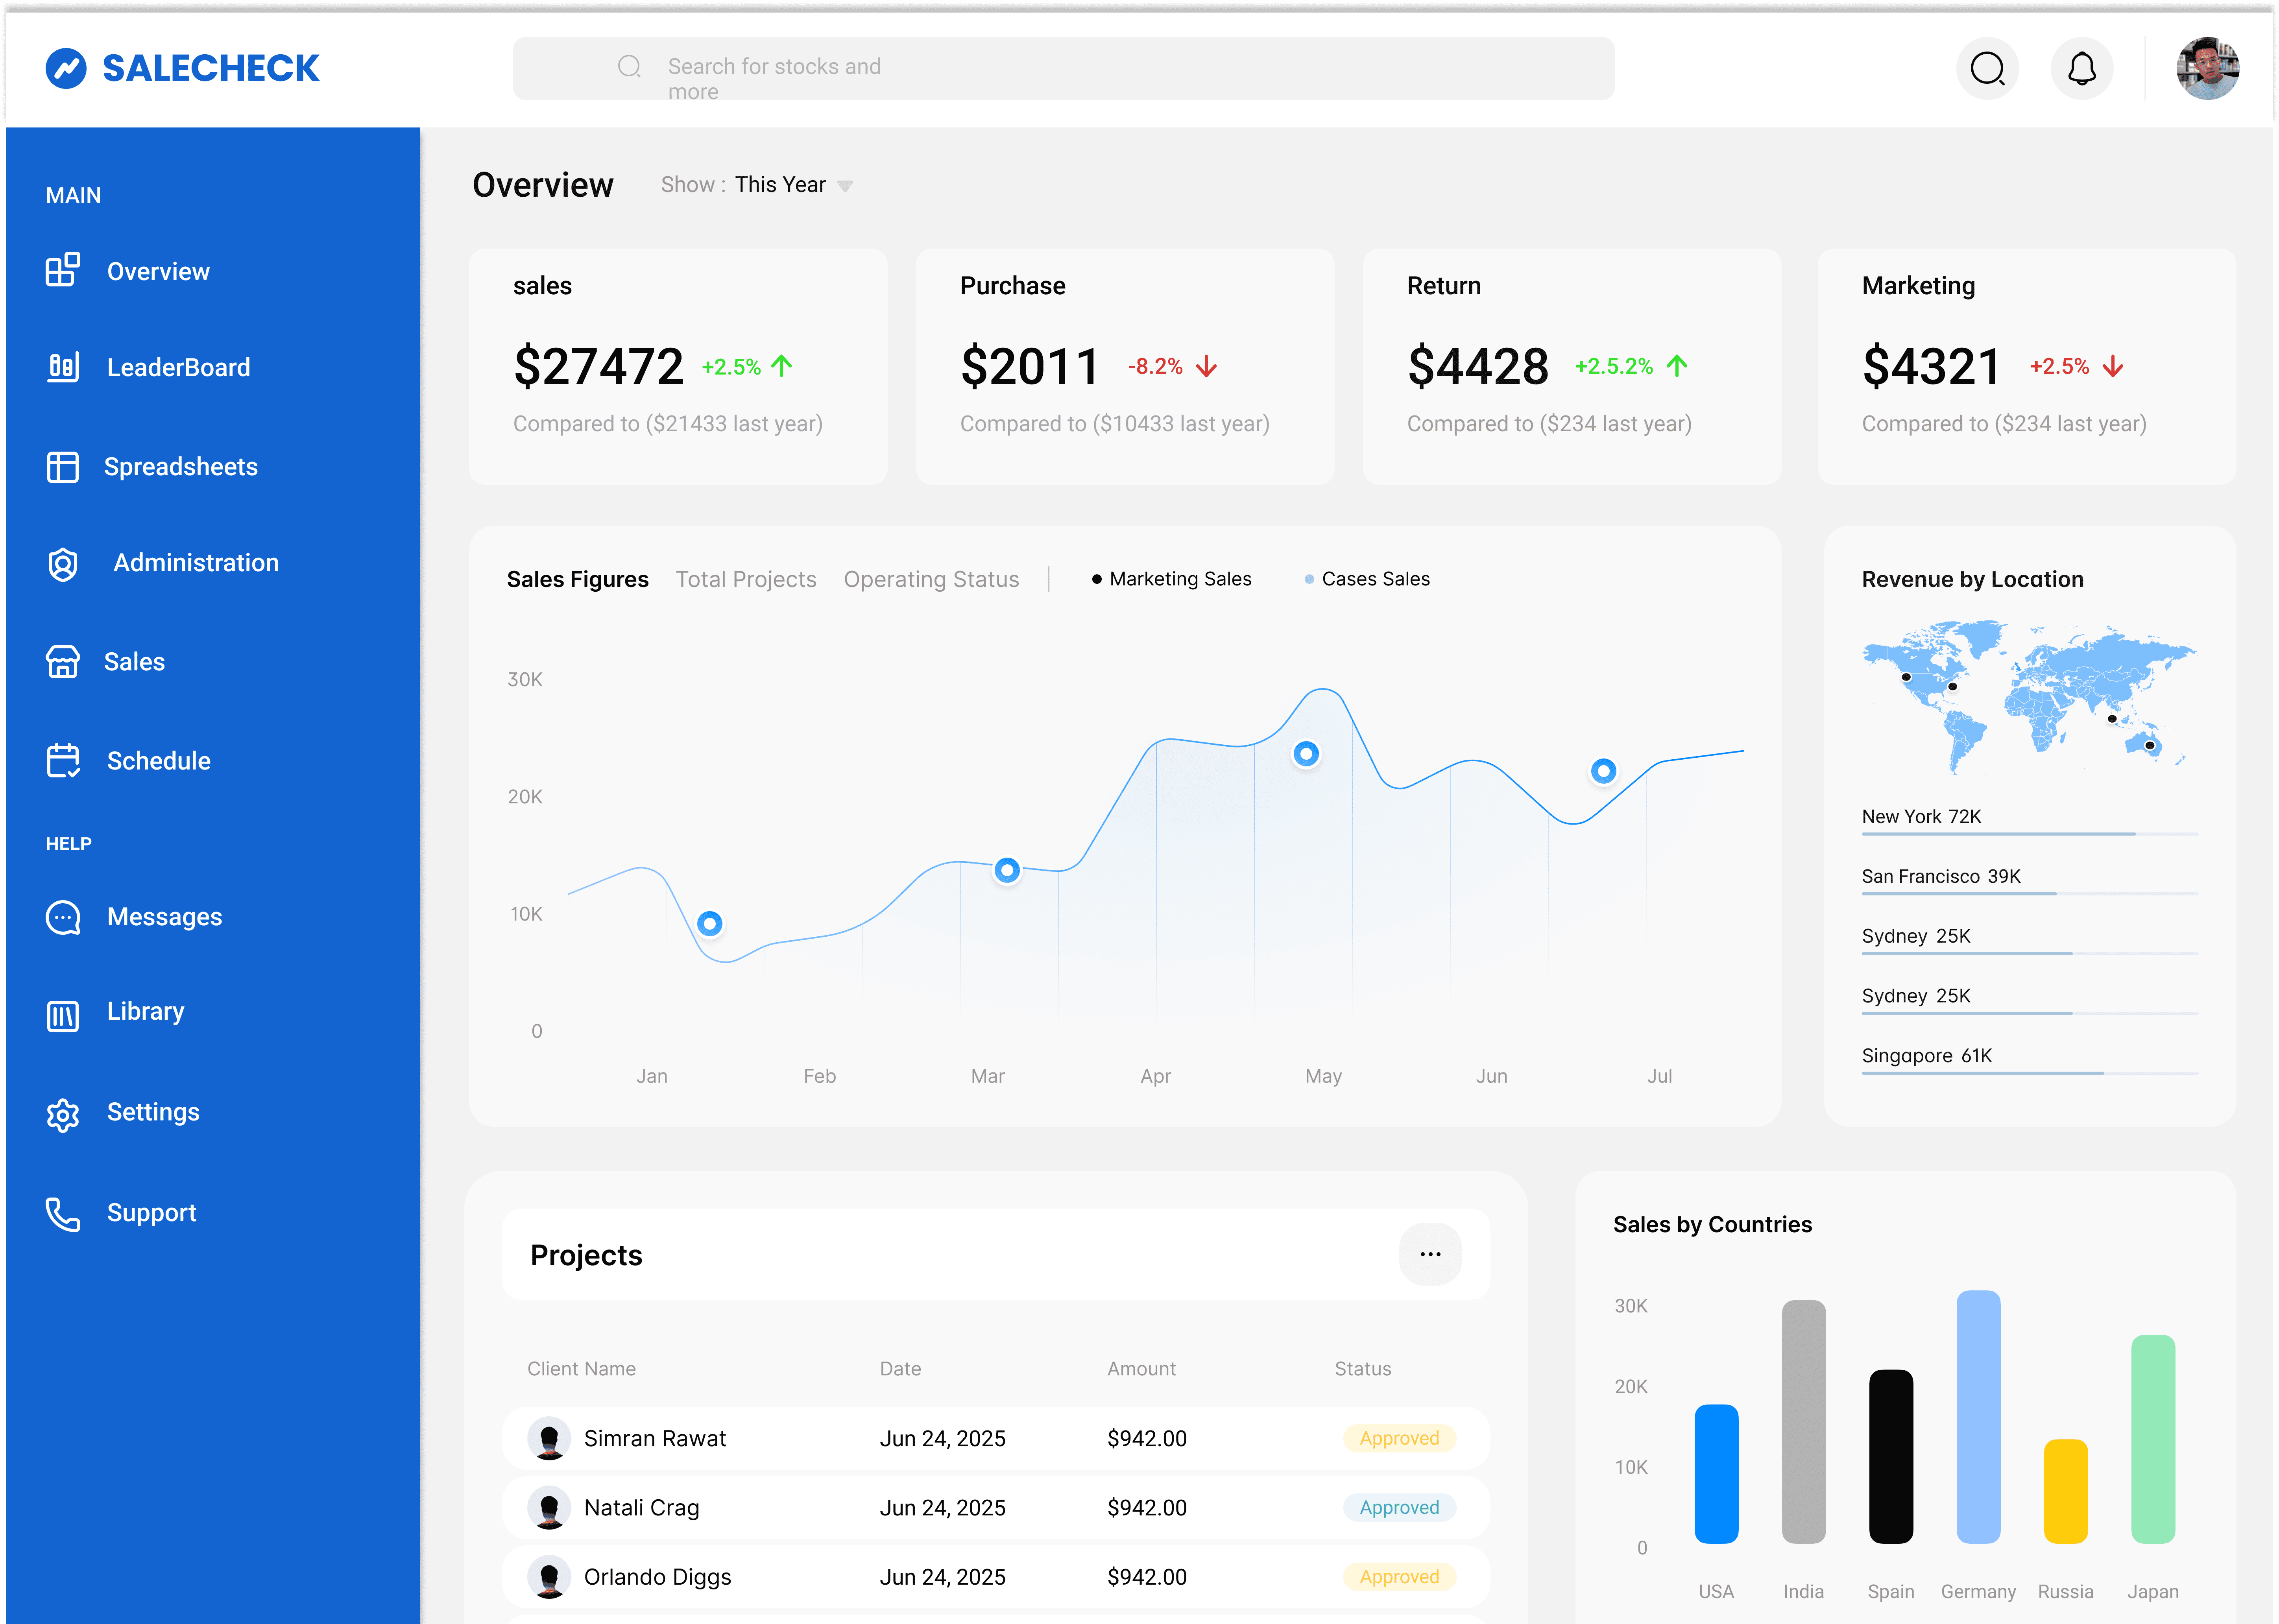
Designed a trading platform dashboard focused on real-time data visibility and quick decision-making. Prioritized above-the-fold metrics, used data tables with clear status indicators, and structured the layout to support fast scanning during active trading sessions.
Approach
Focused on organizing data into sections, using card-based layouts, and improving visual hierarchy for quick understanding.